Taking customisation to the next level
Every month at Avarni, we endeavor to offer you a more refined and flexible experience, equipping you to extract actionable insights from your carbon emission data. This month, we're excited to announce a significant enhancement to our platform, merging two of our innovative features for a more seamless user experience.
Custom Fields meet Custom Dashboards!
We’ve now integrated our recently released feature allowing users to create their own Custom Fields with our Custom Dashboards, ensuring your unique organisational data is not only stored but visualised exactly how you need it.
Here’s how it transforms your experience:
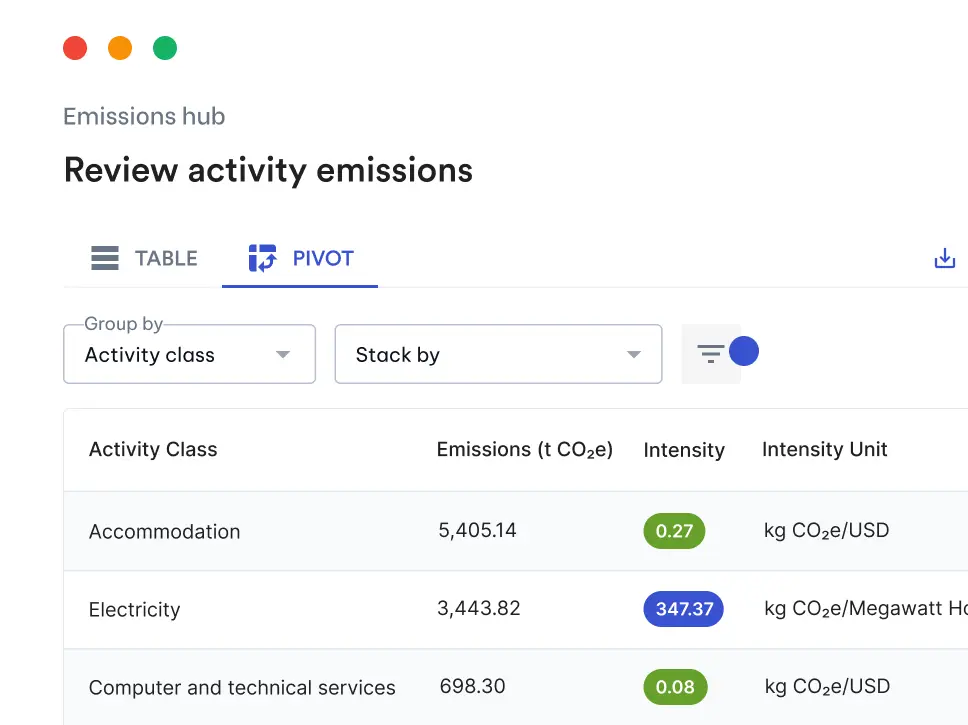
- Familiar visualisation, fresh data: While the graph types remain consistent, you now have the power to plot custom fields within those graphs, giving you broader and more flexible insights.
- Simple integration: Adding custom fields to your dashboards is a simple and straightforward! When creating your custom graph, simply select your custom field from the “Group By” or “Stack By” dropdown menu. No additional steps needed.
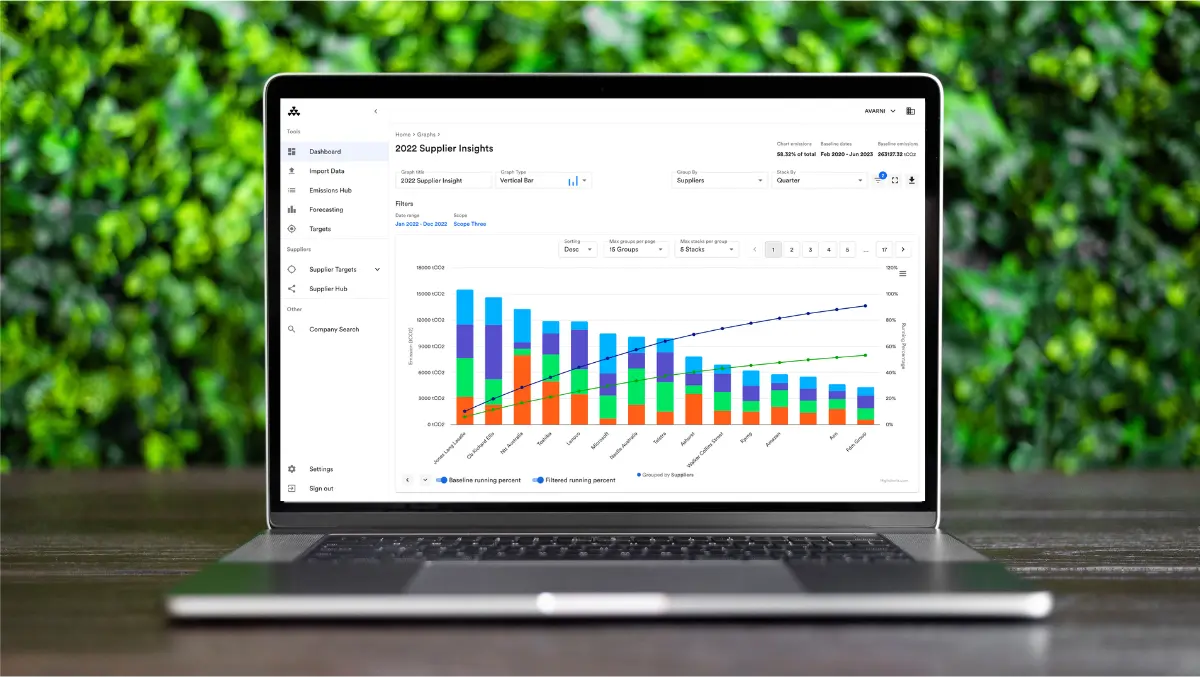
- Your data, your story: Whether it's specific supplier codes, department tags, unique project names, or any other bespoke data fields, you can now create graphs that tell your organisation's unique carbon emission narrative.
Coming soon: Keep an eye out for tutorials and support content that will guide you in maximising this feature, set to be released over the next month!
Share your experience
Your feedback has been invaluable in crafting this feature blend. As you explore this new capability, we'd love to hear your thoughts and how it's enhancing your carbon tracking experience.
Bug fixes
In addition to the new feature, we have made minor improvements and bug fixes. Some of the key bug fixes include:
- Variances in the dates of emission entries due to differing time zones has now been resolved to ensure the same date and time of an entry is displayed regardless of the time zone the data has been uploaded in or the location of the user that is viewing the data.
- Some emission entries that had been manually created in the Emissions Hub were not being included when creating a Custom Graph. This bug has now been resolved to ensure all data that sits in the Emissions Hub is accounted for in any Custom Graph.
If you’re not already using Avarni to manage your carbon emissions, get in touch to see a live product demo and learn how we can help you with your decarbonization goals.